
Population
Summary
We have estimated the population of a given postcode, which only takes into account usual residents in the area who live there on a permanent or almost permanent basis. In addition, we have also calculation the population density of the selected postcode, which is obtained from dividing the area’s population by its surface area.
Definition
We have defined people as being ordinarily residents in your area based on the legal definition, according to which a person is ordinarily resident if they regularly, voluntarily and habitually carry out the “living of life”, in a particular place, persistently, apart from temporary or occasional absences. What that means (without the legalese) is that if someone were to ask you where you live, whatever your first answer would be, we would count you as ordinarily resident there.
You can see the population number, which means that you know what your population number means. We have broken down the data so that you can understand what your population number means relative to other postcodes in London. The quartile number assigned to each area can be interpreted as follows:
| Dataset | Explanation |
|---|---|
| Postcode Total Population | This is the total number of people living in your postcode. |
| Postcode Population Density | This is the number of people living in your postcode per square kilometer. |
| Borough Population Density | This is the number of people living in your borough per square kilometer. |
| Postcode Quartile Placement for Population Density | This tells you which quartile (25% band) your postcode falls into regarding population density within the the overall distribution of postcodes across London. |
| Postcode Z-Score for Population Density | This tells you how many standard deviations above or below the mean your postcode is regarding population density compared to the overall distribution of postcodes across London. |
| Location Quotient | Location quotient is an index for comparing a region’s share of a particular activity (in this case postcode population) with the share of that activity found across a larger area. If Location Quotient is more than 1 this indicates a relatively concentrated population in the postcode compared to Borough’s share of London’s population. If Location Quotient is less than 1 this indicates a relatively dispersed population in the postcode compared to Borough’s share of London’s population. |
Why the metric matters from a commercial inhabitant’s perspective
The population of a given area matters for commercial inhabitants. This is important because a high population number relative to the surrounding areas is likely to indicate that the neighbourhood with a higher population is a focal point for activity within a wider area. Therefore it is likely to be the best place to situate economic activities that rely on ease of accessibility to or on passing trade, such as shops, pubs and restaurants.
Lower relative population numbers are an indicator of low density suburban living in which a relatively large area of land is used to house a relatively small population.
Why the metric matters from a residential inhabitant’s perspective
In general, the greater the population of an area and its surroundings the greater the demand for use of spatial resources such as roads and parks. Similarly, social resources such as schools, hospitals and cafés are likely to be well utilised. Living in an area with a high population will likely mean that your locale feels busier than average.
If you are a person who likes living within a vibrant urban scene then you would seek out an area in which the population number is slightly higher. However, if you are a person who likes a slightly quieter lifestyle, then you would seek out an area with a lower population as this is likely to provide a milder residential scene, especially where an area has a low Rurality Zoning Score. The downside however to London’s lower population areas is that they are less likely to be served as well as higher population areas by public transport, making them more susceptible to peak travel time traffic.
(Photograph: Wikimedia Commons)
General commentary
Population numbers in a given area are normally proportional to the distance an area is from central London. The theory follows that as people require more space for their money, they are more inclined to be situated in less populous areas which traditionally tend to be further away from the centre of London.
Whilst there are exceptions to this theory in terms of effect on residential amenity, population numbers have been shown to have one of two outcomes on quality of life. On the one hand there is evidence to suggest that less populous areas have a greater perception of community amongst residents as social networks are considered to be of a more manageable size.
On the other hand evidence also proves the fact that less populous areas are also the areas in which the services which so many urban dwellers desire, such as a range of shops, restaurants and leisure facilities are less common and often require a car journey to access them, thus leaving people with a lesser sense of attachment to their immediate area as they often have to travel some distance to access the leisure services of their choice.
A point worth noting is that population figures are completely influenced by peoples’ individual preferences, local contexts (such as the cost, age, and type of housing), neighbourhood composition in terms of race, income, education, age, etc.) employment opportunities, greenspace, school quality and other such similar things (as well as macro-scale processes and events such as the overall economic climate).
We therefore do not advise making any general conclusions as to what a population number alone tells us at a given point in time. That being said, the trend over time is useful as a measure to support other theories about neighbourhood popularity, demographic composition, local amenity and the like.
Trivia
Interestingly, London was the first city to reach a population of more than one million, in 1811. It remained the largest city in the world until it was overtaken by Tokyo in 1957.
History
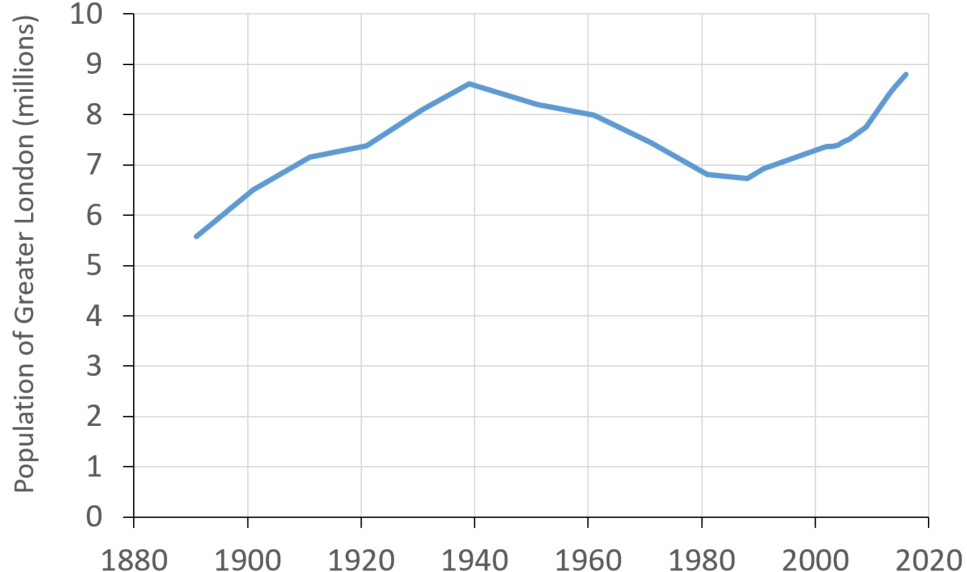
The population of people living in central London, (which can roughly be classed as an area a little larger than London Underground Zones 1 and 2) has increased by 340,000 since 2011 to around 3.4 million (as at the end of 2017). The outer areas of London on the other hand have seen a roughly 360,000 increase taking the population to around 5.5 million. Outer London’s population accounts for roughly 65% of the total.
These numbers are projected to grow to 3.7 and 5.6 million respectively by 2021. Inner London’s population remains well below its historic peak of 5 million before the second World War. The 1930s was the last time that the population of inner London was larger than that of outer London.